
Tyler Texas Vital Statistics, Population, Demographics, and Census Figures
![]() |
Tyler is located in, and the county seat of, Smith County, Texas.
Area of Tyler
Tyler occupies an area of about 50 square miles, while Smith County covers about 949 square miles.
Altitude
The elevation of Tyler is 544 feet (165 meters) above sea level, while elevation levels in Smith County range from 300 to 600 feet.
Geographic Location
Tyler is located in the Piney Woods section of East Texas, about half-way between Dallas and Shreveport, just south of the Interstate I-20 corridor, at latitude 32°21'04"N, longitude 95°18'03"W
Population of Tyler Texas in 2018
According to U.S. Census Bureau estimates released in May of 2014, Tyler's population was 100,223, a 3.4% increase from the census total of 96,900 in 2010.
Smith County's population was reported in 2010 to be 209,714, a 20% increase from 174,706 in 2000.
The Tyler Area Metropolitan Planning Organization estimates the population of Tyler in March of 2018 at 105,719. Read current population estimates at Census.gov.
Tyler Texas Area Code
903
Climate
Tyler has a relatively mild climate. The record high for Tyler is 111°F (44°C), which occurred on July 31, 1921.
The record low for Tyler is -3°F (-19°C), recorded on January 18, 1930. Average annual rainfall is 45.4".
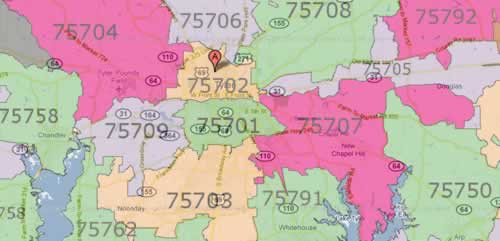
Zip Codes for the Tyler Metropolitan AreaZip Code 75701 - Zip Code 75799 (see more Tyler Zip Code details) |
Tyler and Smith County Population by Decade over the Last 90 Years
Census Year |
City of Tyler |
Smith County/Tyler MSA |
|
1920 |
12,085 |
46,769 |
|
1930 |
17,113 |
53,123 |
|
1940 |
28,279 |
69,090 |
|
1950 |
38,968 |
74,701 |
|
1960 |
51,230 |
86,350 |
|
1970 |
57,000 |
97,096 |
|
1980 |
70,508 |
128,366 |
|
1990 |
75,450 |
151,309 |
|
2000 |
83,650 |
174,706 |
|
2010 |
96,900 |
209,714 |
|
2014 |
100,223 |
![]() |
The January mean minimum temperature is 38 degrees, while the July mean maximum is 94 degrees. Tyler typically experiences 245 days of sunny weather annually. Current weather conditions in Tyler
More About Tyler
Read more about Tyler on WikiPedia, and view Tyler on Google Maps.
For detailed, current information, on a variety of subjects such as employment, workforce, taxes, cost of living, and demographics we recommend you contact the Tyler Area Chamber of Commerce and the Tyler Economic Development Council.
City of Tyler 2010 Census Data from the U.S. Census Bureau
People QuickFacts | Tyler | Texas |
---|---|---|
Population, 2011 estimate | NA | 25,674,681 |
Population, 2010 | 96,900 | 25,145,561 |
Population, percent change, 2000 to 2010 | 15.8% | 20.6% |
Population, 2000 | 83,650 | 20,851,820 |
Persons under 5 years, percent, 2010 | 7.2% | 7.7% |
Persons under 18 years, percent, 2010 | 24.3% | 27.3% |
Persons 65 years and over, percent, 2010 | 14.4% | 10.3% |
Female persons, percent, 2010 | 52.8% | 50.4% |
White persons, percent, 2010 (a) | 60.5% | 70.4% |
Black persons, percent, 2010 (a) | 24.8% | 11.8% |
American Indian and Alaska Native persons, percent, 2010 (a) | 0.5% | 0.7% |
Asian persons, percent, 2010 (a) | 1.9% | 3.8% |
Native Hawaiian and Other Pacific Islander, percent, 2010 (a) | Z | 0.1% |
Persons reporting two or more races, percent, 2010 | 2.0% | 2.7% |
Persons of Hispanic or Latino origin, percent, 2010 (b) | 21.2% | 37.6% |
White persons not Hispanic, percent, 2010 | 50.8% | 45.3% |
Living in same house 1 year & over, 2006-2010 | 76.5% | 81.5% |
Foreign born persons, percent, 2006-2010 | 11.3% | 16.1% |
Language other than English spoken at home, pct age 5+, 2006-2010 | 18.6% | 34.2% |
High school graduates, percent of persons age 25+, 2006-2010 | 83.7% | 80.0% |
Bachelor's degree or higher, pct of persons age 25+, 2006-2010 | 29.0% | 25.8% |
Mean travel time to work (minutes), workers age 16+, 2006-2010 | 17.9 | 24.8 |
Housing units, 2010 | 41,742 | 9,977,436 |
Homeownership rate, 2006-2010 | 56.9% | 64.8% |
Housing units in multi-unit structures, percent, 2006-2010 | 30.5% | 24.1% |
Median value of owner-occupied housing units, 2006-2010 | $123,600 | $123,500 |
Households, 2006-2010 | 37,429 | 8,539,206 |
Persons per household, 2006-2010 | 2.48 | 2.78 |
Per capita money income in past 12 months (2010 dollars) 2006-2010 | $27,169 | $24,870 |
Median household income 2006-2010 | $41,607 | $49,646 |
Persons below poverty level, percent, 2006-2010 | 20.2% | 16.8% |
Business QuickFacts | Tyler | Texas |
---|---|---|
Black-owned firms, percent, 2007 | 9.2% | 7.1% |
American Indian- and Alaska Native-owned firms, percent, 2007 | S | 0.9% |
Asian-owned firms, percent, 2007 | S | 5.3% |
Native Hawaiian and Other Pacific Islander-owned firms, percent, 2007 | F | 0.1% |
Hispanic-owned firms, percent, 2007 | S | 20.7% |
Women-owned firms, percent, 2007 | 23.6% | 28.2% |
Manufacturers shipments, 2007 ($1000) | 4,644,606 | 593,541,502 |
Merchant wholesaler sales, 2007 ($1000) | 608,353 | 424,238,194 |
Retail sales, 2007 ($1000) | 2,653,356 | 311,334,781 |
Retail sales per capita, 2007 | $27,778 | $13,061 |
Accommodation and food services sales, 2007 ($1000) | 273,928 | 42,054,592 |
Geography QuickFacts | Tyler | Texas |
---|---|---|
Land area in square miles, 2010 | 53.86 | 261,231.71 |
Persons per square mile, 2010 | 1,799.2 | 96.3 |
FIPS Code | 74144 | 48 |
(a) Includes persons reporting only one race.
(b) Hispanics may be of any race, so also are included in applicable race categories.
D: Suppressed to avoid disclosure of confidential information
F: Fewer than 100 firms
FN: Footnote on this item for this area in place of data
NA: Not available
S: Suppressed; does not meet publication standards
X: Not applicable
Z: Value greater than zero but less than half unit of measure shown
For more details link to the website of the U.S. Census Bureau